
All the Answers
Well-known member
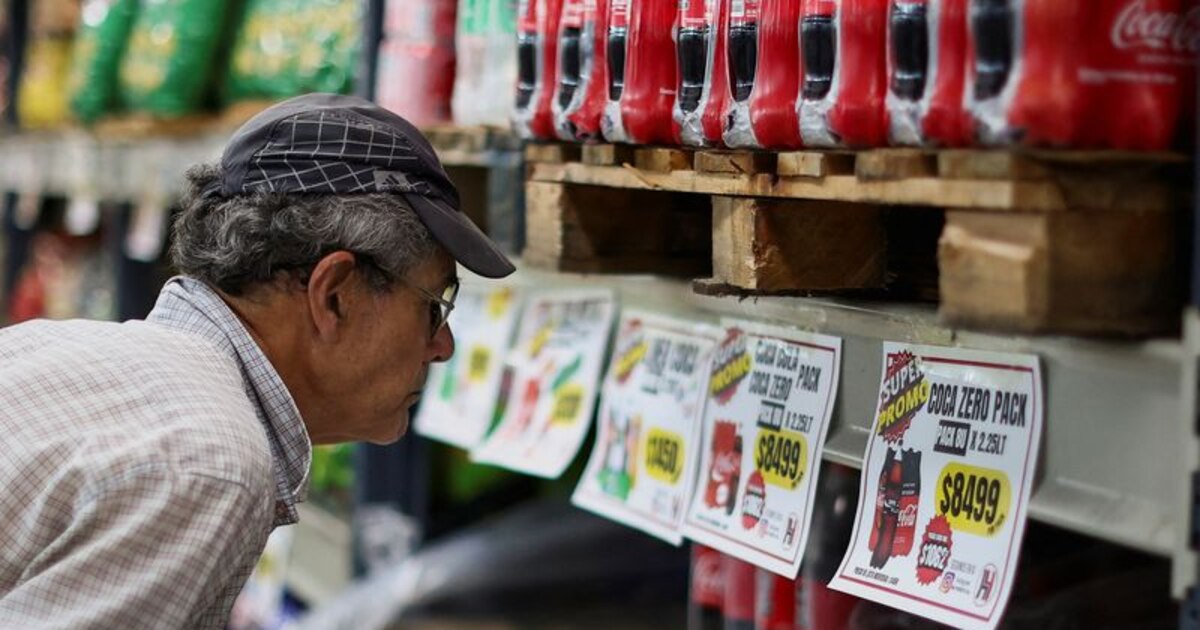
Inflation in the city of Buenos Aires was 4.2% in August and has accumulated 243.1% in the last year - Infobae

Source:
La inflación en la ciudad de Buenos Aires fue del 4,2% en agosto y acumula 243,1% en el último año
Así lo informó el instituto de estadísticas de la ciudad de Buenos Aires; a cuánto llegó desde enero, cuál fue la suba en los alimentos y qué rubros crecieron más que el promedio
 www.infobae.com
This was reported by the Statistics Institute of the City of Buenos Aires; how much has it reached since January, what was the increase in food prices and which items grew more than the average
By Matias Barberia

The inflation figure for August compares with 5.1% in July
Inflation in Buenos Aires was 4.2% last month, 106.8% since January and 243.1% last year. This was reported by the Institute of Census and Statistics of the City of Buenos Aires, which detailed that the price of food and beverages rose 3.1% last month and 238.7% in the last twelve months.
Inflation thus fell by 0.6 points compared to July, mainly due to a slowdown in some key sectors such as seasonal goods. However, it continues to show high year-on-year levels. This trend is also expected to be reflected in the report that Indec will publish next Friday on the national inflation data. In any case, the country continues to occupy a prominent place in the global inflation ranking.
Figures from the Buenos Aires Statistics Institute revealed that the sectors that boosted the index the most in August were transportation, followed by housing and services, due in part to the adjustment of public tariffs. The report indicated that “during the month of August, the Consumer Price Index of the City of Buenos Aires (IPCBA - base 2021 = 100) registered an increase of 4.2%, accumulating an increase of 106.8% in the first eight months of the year.”

"The year-on-year (y-o-y) trend of this indicator was 243.1% (-21.8 percentage points compared to the previous month)," he said.
In August, the variation in the CPIBA was mainly due to increases in the following divisions: Transport, Housing, water, electricity, gas and other fuels, Food and non-alcoholic beverages, and Health, which together accounted for 67.1% of the increase in the general level.
Increases in Transport and Housing
Transport was one of the sectors that contributed most to the rise in inflation in August. It registered a rise of 9.0%, contributing 0.93 percentage points to the monthly increase in the index. This increase was mainly due to the update of the value of urban bus tickets. Also influencing this increase were increases in taxi fares and in the prices of fuel and lubricants for private vehicles.The Housing, water, electricity, gas and other fuels category rose by 4.4%, with an impact of 0.81 points. This increase was explained, above all, by increases in common housing expenses and rents. In addition, residential rates for water and electricity supply services also registered adjustments that impacted the overall increase, although to a lesser extent. Added to this were increases in the prices of home repair services.
Food and non-alcoholic beverages
The Food and non-alcoholic beverages category, which directly affects the most vulnerable sectors, registered an increase of 3.1%, with an impact of 0.60 percentage points on the overall level. Within this category, the largest increases came from Meat and derivatives, which rose by 5.3%, Bread and cereals, with an increase of 4.1%, and Milk, dairy products and eggs, which registered an increase of 3.7%.
The health sector is also on the rise
The Health sector, for its part, rose 5.4%, contributing 0.47 percentage points to the monthly variation. This increase was driven by adjustments in prepaid medical insurance rates, which significantly affected the division. There were also increases in drug prices, which added pressure to this key sector.Incidence of Goods and Services
In the analysis of price changes by type of product, Goods registered a rise of 3.1% in August, while Services increased at a faster rate, with an increase of 4.9%. This trend shows the strong influence of tariff and price adjustments in essential services.So far this year, Goods have accumulated an increase of 83.9%, while Services, affected to a greater extent by increases in rates and rents, registered an increase of 126.3%.
On an annual basis, both groups showed a slowdown, with Goods at 238.7% yoy (-30.5 percentage points compared to the previous month) and Services at 246.3% yoy (-15.7 percentage points).
Core and regulated inflation
When breaking down the index into different groups, core inflation, measured by the Rest of the IPCBA sub-index, averaged an increase of 4.3% in August, while its year-on-year trend slowed to 234.2% (-22.5 percentage points compared to the previous month).For its part, the group of regulated products and services, which includes transportation and public services fares, registered an increase of 7.0%. This increase was mainly driven by increases in prepaid medical fees, urban bus fares, taxi fares and fuel prices. Also influencing this were updates to fees for educational establishments and increases in residential water, electricity and gas rates. On an interannual basis, regulated prices slowed their rate of increase to 318.5% (-16.6 percentage points compared to the previous month).
